
Understanding your audience, their demographics, interests, and behaviors help you improve your online marketing processes. Once you identify who your audience is and what they like (or don’t like), you can optimize a lot of things on your website to cater to them.
Fortunately, Google Analytics provides all this information and more.
The Google Analytics Audience reports contain tons of valuable information and important data about a business’s audience and traffic visitors. By using this information, you can optimize your website, make it more user-friendly, and even introduce new marketing campaigns that will appeal better to your ideal target audience group and potential customers.
In this blog post, we will explore the Google Analytics Audience reports and data segment.
Let’s begin.
How to access Google Analytics Audience reports?
First of all, where is the Google Analytics Audience reports section and how can you access it?
Locate the ‘Audience’ section in the left sidebar and click on it.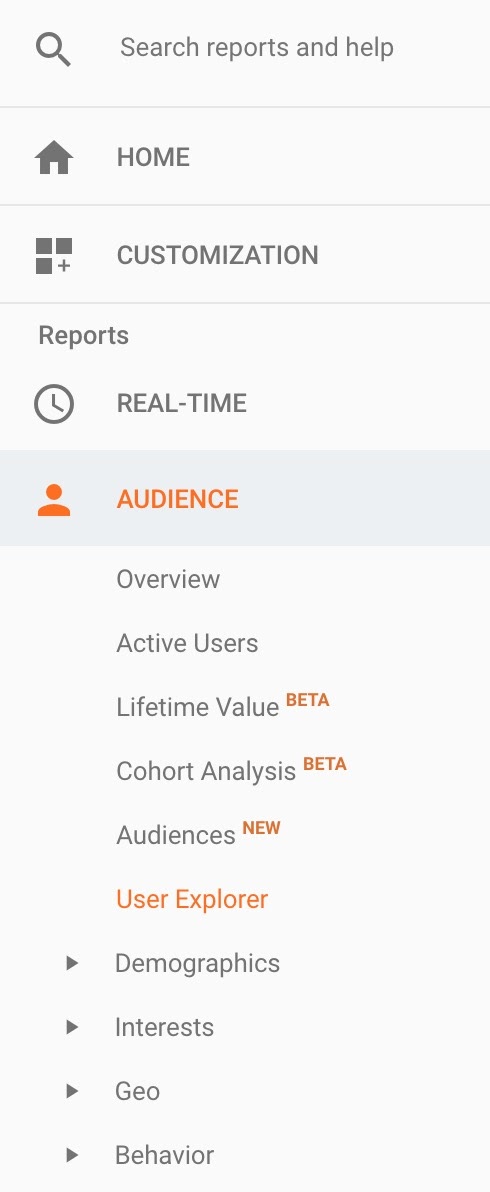
Note: In this article, we will not explain the ‘BETA’ options.
Following is the explanation of the 10 major reports (or sections) that you can find in the Google Analytics Audience Reports segment.
Let’s begin with the ‘Overview’ section.
1. Overview
The ‘Overview’ section gives you a top-level view of the user metrics. It is generally the section that you see first when you log into your Google Analytics dashboard.
Take a look at the following screenshot. It should look familiar.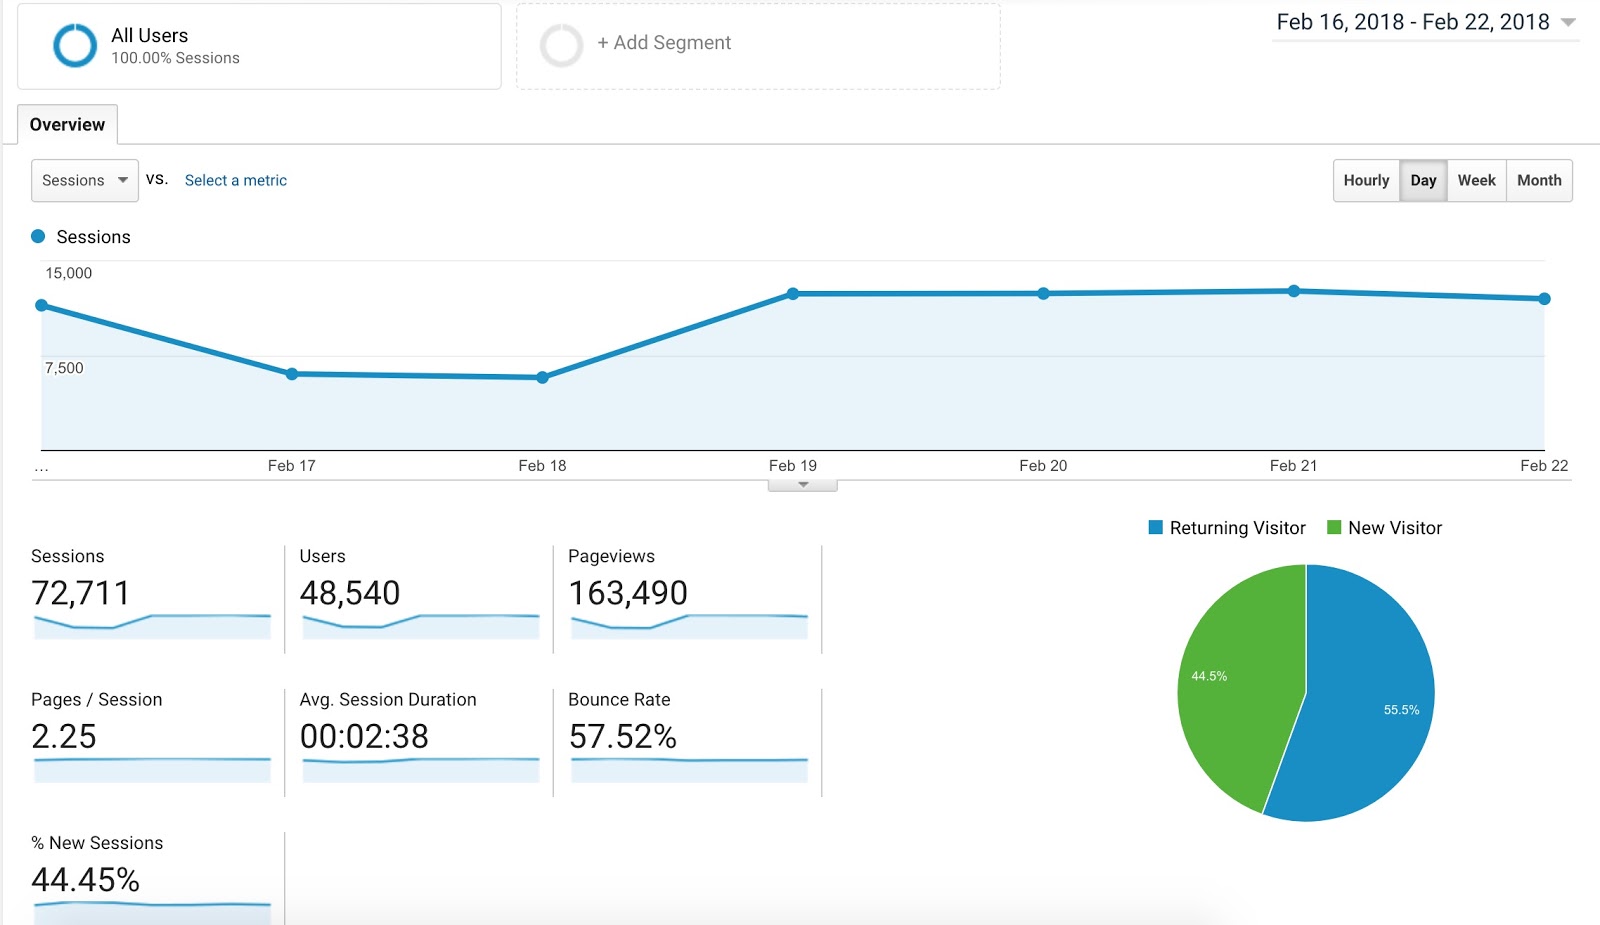
At the top of the ‘Overview’ page, you see a graph which depends on the date range you have selected at the top-right corner of the screen. This graph represents the total number of sessions (for the selected time period) that your website visitors perform on your site.
Underneath the graph, you see other relevant metrics, namely:
- Sessions — the total number of sessions for the selected time period.
- Users — the total number of users that visited your website during the selected date range.
- Pageviews — the total number of pageviews recorded during the selected period.
- Pages/session — this number represents the average number of pages a user visits in his/her session.
- Average session duration — The time in this column represents the average session duration by the users who visit your website.
- Bounce rate — how many people bounced from your website after just visiting a single page.
- New sessions (%) — It is an estimated percentage of the first-time visits, aka new sessions.
If you scroll down further on the Overview page, you will find even more reports. For instance, you will be able to see the top 10 for the following categories:
- Language
- Country
- City
- Browsers
- Operating systems
- Service providers
- Mobile operating systems
- Mobile service providers
- Mobile screen resolution
The following screenshot is just an example of the ‘Country’ report at the end.
The screenshot (Country report) tells you the top 10 countries that are responsible for the most traffic visits to your website. In this example, almost 85% traffic came from the United States of America, followed by Canada (7.79%) and Pakistan (3.82%).
You can get similar reports for Language, City, Browsers, etc.
2. Active users
The ‘Active users’ report isn’t used frequently by small and mid-sized business owners. The ‘active user’ report refers to the number of users who visited your site within the last 1 to 30 days in the selected time period.
Google Analytics allows you to determine the number of users who visited your site in the last 1 day, 7 days, 14 days, or 30 days.
3. Demographics
The ‘Demographics’ section in the Google Analytics Audience reports gives you valuable insights into your visitors’ age groups and genders.
You can quickly see the most profitable age groups and gender on the overview page. This information is valuable when it comes to PPC campaigns.
Furthermore, by diving deeper into the ‘Demographics’ section, you can also identify — provided if you have set up conversion goals — which gender or particular age group has the best conversion rate.
Once you identify the best people to market to who give you the best ROI, you can scale your business efficiently and profitably.
4. Interests
Just like the Demographics section, the Interests section gives you valuable insights into what your website visitors — and potential customers — are interested in.
The ‘Interests’ section is comprised of three major reporting categories:
- Affinity category represents the people who are just starting to know about your business. They are the beginning of the sales cycle. It means you can use these interests to reach out to them and increase your brand awareness.
- In-market segment refers to people who are near the end of the sales cycle process. You can use their interests to make them complete the transaction and purchase from you.
- Other category shows more granular data and represents users that belong to neither of the above-mentioned categories.
This is valuable information if you are running display ads and Facebook ads. If you are running either of those marketing campaigns, you should share this information with your online advertisers.
5. Geo
As the name suggests, the ‘Geo’ section covers the geographical locations and languages of your site’s visitors. The data is displayed in charts as well as a visual representation of the geographical locations in a world map.
6. Behavior
The ‘Behavior’ section includes relatively detailed reports for:
- New vs. returning website visitors
- Frequency and recency of the website visitors
- Engagement
What can you get out of this ‘Behavior’ section in the Audience reports?
Well, you can track behavioral patterns and identify users who are more likely to convert. One of the most common ways to do that is to identify who has a better conversion rate: a new visitor or a returning visitor.
You can then run email marketing campaigns and perform marketing activities to ensure that you’re driving the right type of traffic that converts better.
7. Technology
If you are interested in finding out more about the browsers and operating systems that your website visitors use, you should look into the Technology section of the Audience reports.
This is an important report in a sense that you should know which browser or operating system your visitors use the most. Then you should make sure that your website is fully optimized for that segment, so the majority of your site visitors have the best possible user experience.
8. Mobile
Optimizing your site for mobile is a no-brainer. You can’t expect a profitable, high-ranking website without making mobile a high-priority.
The ‘Mobile’ report in the Google Analytics Audience section gives you the data and information that reinforces the importance of mobile optimization.
You can see the exact devices that visitors use to come to your website, so you can make sure that your site looks at its best on those devices (iPhones, Android phones, iPads, Windows phones, etc.)
9. Custom
Want to create your own custom report? Then dive into the ‘Custom’ section.
However, be aware that this is an advanced report in which you will have to define your own variables, metrics, and dimensions in order to create a report.
10. Users Flow
Interested in seeing the path that your visitors take through your website? Users Flow is the section you need to check out.
One important point to note here is that you can select different dimensions at the top-left corner of the User Flow screen to filter users based on language, browser, location, mobile devices, etc.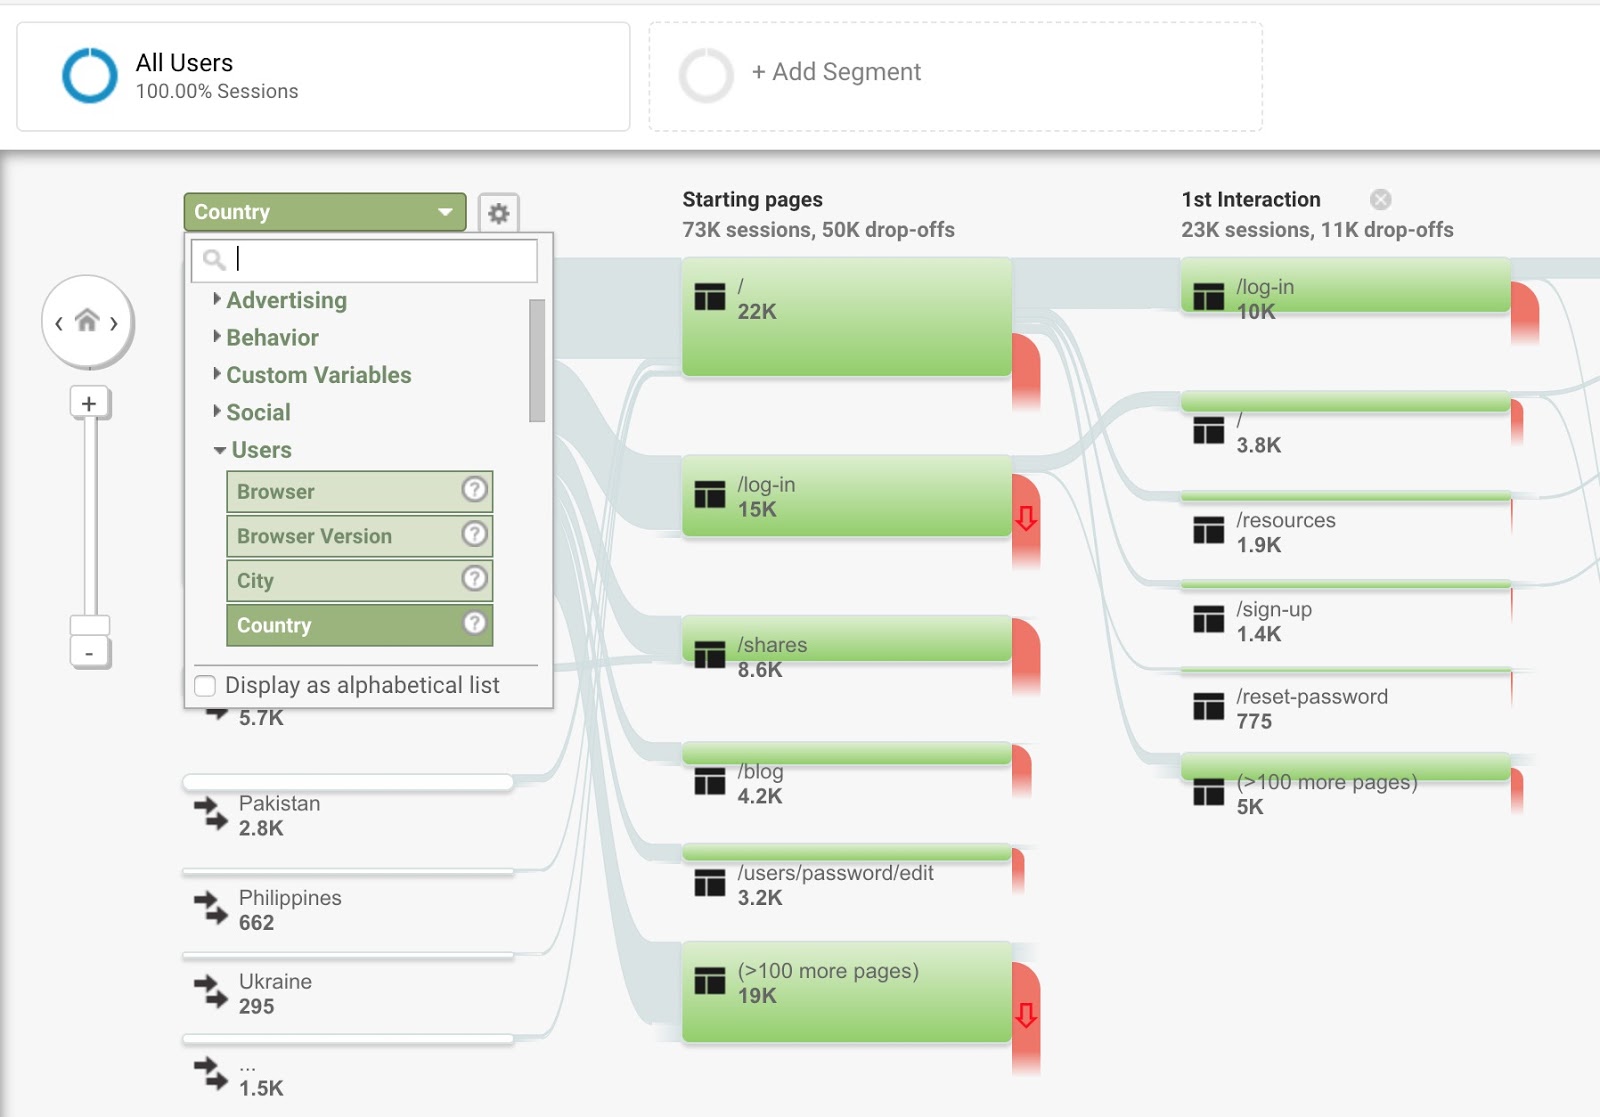
What’s next?
The Google Analytics Audience reports give you valuable insights into your audience and potential customers. You can identify the audience groups that are most profitable for you — as well as what you have to do to give them the best user experience.
If you are interested in learning more about Google Analytics, read the following articles: