Archived

SEO Report for https://ezzetv.co.uk

Your general SEO Checkup Score


SEO Score71/100
Average SEO score of top 100 sites: 75%This value indicates the average SEO score of the top 100 most visited websites in the US (in the past 12 months)
AI Visibility66/100
AI visibility score reflects brand reach in AI

Your site scored 71/100, below the 75 average for top sites. We found 15 issues to fix, and clearing them is how you move up. And an AI Visibility Score of 66/100 means ChatGPT, Gemini and Perplexity mention your brand some of the time, with clear room to push further.

15 Failed
2 Warnings
46 Passed

Want to fix these issues and track your progress?

Issues to fix

HIGH
To provide a good user experience, Google recommends that sites should aim for a Largest Contentful Paint duration of 2.5 seconds or less.
Details
HIGH
To improve the website experience for your visitors, it is recommended to eliminate any render-blocking resources on this webpage.
Details
HIGH
Users may abandon pages that take longer than 5 seconds to load, resulting in a potential loss of up to 50% of visitors. Faster loading pages can lead to increased traffic, better conversions, and higher sales.
Details
MEDIUM
Serving resources (images, JS, CSS) from a CDN service, could improve website loading times, reduce bandwidth costs and increase content availability and redundancy.
Details
MEDIUM
Serve properly sized images to reduce page loading times and to improve user's experience.
Details
MEDIUM
Avoid using distorted images, as they can have a negative impact on the user experience.
Details
MEDIUM
To provide a good user experience, Google recommends that sites should aim for a Time To First Byte value of 0.8 seconds or less.
Details
MEDIUM
To provide a good user experience, Google recommends that sites should aim for a First Contentful Paint value of 1.8 seconds or less.
Details
MEDIUM
Add a Google Analytics script to this website to help in diagnosing potential SEO issues by monitoring site visitors and traffic sources.
Details
LOW
Consider reducing the HTML size to improve loading times and retain visitors.
Details
LOW
Reducing the Document Object Model (DOM) size can lead to faster page loading times, improved site performance, and better user experience by decreasing the amount of time it takes for the browser to process and render the page.
Details
LOW
Resolving errors identified by the Chrome DevTools Console can improve user experience.
Details
LOW
Using more than 20 HTTP requests on a webpage can negatively impact the loading time.
Details
LOW
Consider adding the Strict-Transport-Security header to your webpage to ensure that web traffic is encrypted over HTTPS, mitigating the risk of man-in-the-middle attacks and other security threats.
Details
LOW
This website either lacks a favicon or it has not been referenced properly.
Details

AI Insights

Score:0
Failed:0
Warnings:0
Passed:5
Domain Business Context
Understanding the business context of a domain can help you create content that is more relevant to your target audience and differentiate your website from competitors.

What is this domain about

UK IPTV subscription service offering live TV, sports streaming, VOD, and setup guides.

Industry Niche

IPTV streaming subscriptions

Target Audience

Viewers in the UK and Europe seeking low-cost IPTV access to live sports, premium channels, and multi-device streaming.

This test will check the business context of the domain associated with the analyzed webpage. The business context includes the domain's description, target audience and industry niche (if applicable). Understanding the business context of a domain can help you create content that is more relevant to your target audience and differentiate your website from competitors.
LLM Visibility Checker

Track your brand across ChatGPT, Gemini and Claude

Get an AI Presence Score, see which of your pages get cited, and follow how you compare with competitors over time.

How visible your brand is to AI engines
Content Strengths and Weaknesses

This webpage is highly conversion-focused and covers the service offering in depth, with extensive product, support, and FAQ content. However, it relies heavily on promotional claims and testimonials, with limited independent evidence or transparent company information.

Content Strengths

  • Clear service positioning
  • Strong topical coverage
  • Detailed FAQ section

Content Weaknesses

  • Heavy promotional language
  • Limited evidence support
  • Mixed language consistency
This test will analyze the content of the webpage to identify its strengths and weaknesses. The analysis includes factors such as keyword usage, readability, originality, and relevance to the target audience. By understanding the strengths and weaknesses of your content, you can make informed decisions about how to improve it and better meet the needs of your audience.
Content Trust
57%
Topical Relevance95%
Subject Expertise72%
Credibility35%

This webpage appears moderately trustworthy for topical relevance because it stays tightly focused on IPTV subscriptions, setup, and sports streaming. Credibility is weaker because the page shows contact and policy-style links but lacks clear company transparency, independent validation, or cited evidence for its performance claims.
This test will evaluate the trustworthiness of the content on the webpage. It assesses factors such as the credibility of sources, accuracy of information, and overall reliability. A high level of content trust can enhance your website's reputation and improve its ranking in search engine results.
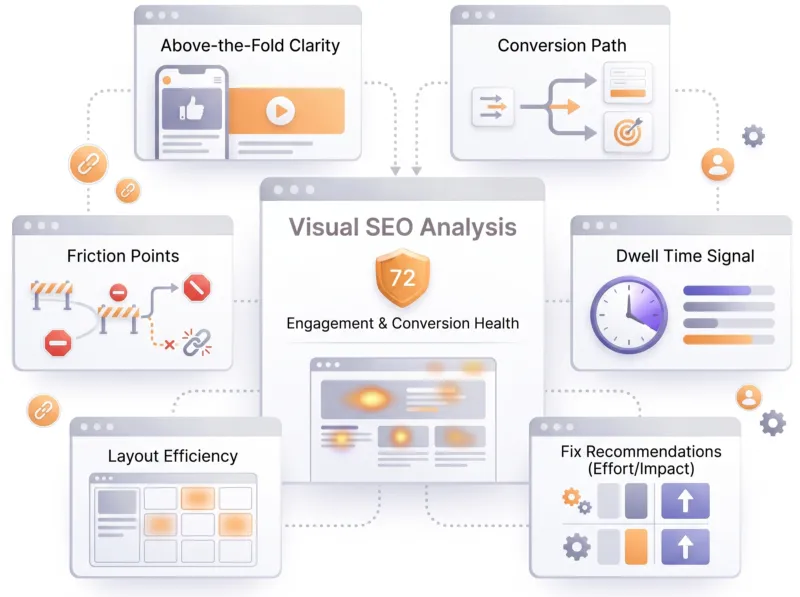
Visual SEO Analysis
Visual SEO Analysis

Find out if your page design converts the visitors you earn

We score six things that decide whether a visitor stays and acts, from the first screen to the path to action, and rank every fix by effort and impact.

How your page's design and UX affect conversions
Content Freshness
91%

The page contains several strong freshness signals, especially 2026 season references, recent article dates, and current sports/event coverage. The footer copyright is also current, and the content appears actively maintained rather than static.

Positive Signals

  • 2026 season references
  • Recent article publish dates
  • Current sports/event coverage
This test will check the freshness of the content on the webpage. It evaluates how recently the content was created or updated, and whether it remains relevant to current trends and user interests. Fresh content can attract more visitors and improve your website's ranking in search engine results.
Content Opportunities

The site already covers the core buying journey well, but it could become more authoritative by adding proof, transparency, and deeper educational resources. The biggest opportunities are to strengthen trust signals, expand comparison content, and turn promotional claims into evidence-backed resources.

Quick Wins

  • •Add a visible methodology note explaining how uptime, channel counts, and buffering claims are measured.
  • •Link the About, Terms, Privacy, and Refund pages directly in the footer and main navigation.
  • •Turn the FAQ into a structured troubleshooting section with jump links for buffering, activation, and device setup.
This test will identify potential content opportunities for the webpage. It analyzes the current content landscape, identifies gaps in coverage, and suggests topics or keywords that could be targeted to attract more visitors and improve search engine rankings.

Common SEO issues

Score:74
Failed:5
Warnings:1
Passed:13
Meta Title Test
100% of top 100 sites passed
This webpage is using a title tag.
Text: Best IPTV UK 2026: Stable 4K Streaming, No Buffering
Length: 52 characters
The meta title is an HTML element that defines a page's title, displayed in search engine results, browser tabs, and bookmark lists. A concise, keyword-relevant title is a strong on-page ranking signal and a major driver of organic click-through rate. AI answer engines and LLM-driven search experiences also rely on the title to identify, summarize, and cite the page in generative results.
Meta Description Test
92% of top 100 sites passed
This webpage is using a meta description tag with a length of 146 characters. We recommend using well-written and inviting meta descriptions with a length between 150 and 220 characters (spaces included).
Text: The best IPTV UK service with stable 4K streaming and 36,000+ HD channels from £3.33/month. Instant activation, no buffering and a free 24h trial.
Length: 146 characters
The meta description is an HTML tag that provides a short summary of a page's content, often shown beneath the title in search results. While not a direct ranking factor, an accurate and inviting description significantly improves click-through rate from organic listings. AI answer engines and social platforms also use it as a trusted summary when generating previews, citations and shareable snippets.
Google Search Results Preview Test
Desktop version
https://ezzetv.co.uk/Best IPTV UK 2026: Stable 4K Streaming, No BufferingThe best IPTV UK service with stable 4K streaming and 36,000+ HD channels from £3.33/month. Instant activation, no buffering and a free 24h trial.
Mobile version
https://ezzetv.co.uk/Best IPTV UK 2026: Stable 4K Streaming, No BufferingThe best IPTV UK service with stable 4K streaming and 36,000+ HD channels from £3.33/month. Instant activation, no buffering and a free 24h trial.
A simulated preview of how the page may appear in Google search results, combining the title, URL, and meta description as Google typically renders them. Useful for spotting truncated text, weak phrasing, or missing elements before publishing, since the snippet directly influences whether searchers click through.
Social Media Meta Tags Test
89% of top 100 sites passed
This webpage is using social media meta tags.
Open Graph Meta Tags
og:localeen_GB
og:typewebsite
og:titleBest IPTV UK 2026: Stable 4K Streaming, No Buffering
og:descriptionThe best IPTV UK service with stable 4K streaming and 36,000+ HD channels from £3.33/month. Instant activation, no buffering and a free 24h trial.
og:urlhttps://ezzetv.co.uk/
og:site_nameEzzeTV
og:updated_time2026-08-20T17:55:25+02:00
Twitter Card Meta Tags
twitter:cardsummary_large_image
twitter:titleBest IPTV UK 2026: Stable 4K Streaming, No Buffering
twitter:descriptionThe best IPTV UK service with stable 4K streaming and 36,000+ HD channels from £3.33/month. Instant activation, no buffering and a free 24h trial.
twitter:label1Time to read
twitter:data120 minutes
Open Graph and Twitter Card meta tags tell social platforms and link unfurlers how to display a page when its URL is shared. Well-formed tags produce richer previews with the intended title, description, and image, which improves click-through on social channels. They also serve as a structured signal that AI crawlers and answer engines can use when summarizing the page.
Most Common Keywords Test
There is likely no optimal keyword density (search engine algorithms have evolved beyond keyword density metrics as a significant ranking factor). It can be useful, however, to note which keywords appear most often on your page and if they reflect the intended topic of your page. More importantly, the keywords on your page should appear within natural sounding and grammatically correct copy.
120iptv
57channels
45premium
43subscription
43streaming
A frequency analysis of the most repeated words and phrases in the page's visible content. Useful for getting a quick sense of which topics search engines are likely to associate with the page, and for spotting cases where the actual content drifts from the intended subject.
Keywords Usage Test
48% of top 100 sites passed
The most common keywords of this webpage are distributed well across the important HTML tags. This helps search engines to properly identify the topic of this webpage.
Keyword
Title tag
Meta description
Headings
iptv
channels
premium
subscription
streaming
Cross-checks whether the most frequently used keywords on the page also appear in the title and meta description. Alignment between body content and metadata helps search engines confirm the page's topic and reinforces relevance for those terms.
Keywords Cloud Test
access
activation
android
anti
apple
apps
available
best
buffering
catalogue
catch
champions
channel
channels
choose
code
codes
comparison
compatible
complete
connection
content
days
devices
dolby
european
events
ezzetv
family
fast
films
football
free
freeze
guarantee
guide
included
installation
instant
international
interruptions
iptv
january
league
leagues
live
matches
minutes
money
month
multi
netflix
offer
pages
payment
perfect
picture
pillar
plan
plans
player
premier
premium
providers
quality
really
rugby
samsung
screens
secure
series
servers
service
setup
single
smart
smarters
smooth
sport
sports
stable
standard
step
stick
streaming
subscription
support
technology
thanks
tivimate
trial
tutorials
ultra
updated
verified
view
vision
watch
whatsapp
xtream
A visual word cloud of the page's content, with more frequent terms shown in larger text. Provides a quick at-a-glance view of which words dominate the page, helping confirm that the visible content reflects the intended topic.
Competitor Domains Test
Competitor Domains

Understand your competitors' SEO and backlink profile

Get related competitors and their domain authority score in relation to your domain.
Identifies up to ten domains that compete for similar organic search results, ranked by overall domain authority based on the volume and quality of their backlink profiles. Useful for benchmarking the competitive landscape and prioritizing which sites to study for content and link-building strategy.
Heading Tags Test
62% of top 100 sites passed
This webpage contains headings tags.
H1 tags
The Go-To IPTV in the UK —Smooth 4K Streaming With No Buffering
H2 tags
Why Choose EzzeTV?
Try It Free For 24 Hours
+35 000 TV Channels & 80 000 Films VOD
Live Sport: top leagues, Champions League et Plus
Compatible with All Your Devices
They Put Their Trust in Us — +15 000 Subscribers
Our Latest Articles
Questions Frequent
Inspects the page for H1 and H2 heading tags and reports their structure. Headings give both users and search engines a clear outline of the page's topics, with the H1 acting as the primary subject and H2s framing major sections. A clean heading hierarchy also helps AI answer engines segment the content into discrete passages they can quote or summarize.
Robots.txt Test
99% of top 100 sites passed
This website is using a robots.txt file.
Verifies whether the site exposes a robots.txt file at the root domain. This file is the first resource most crawlers request, telling search engines and other bots which paths they may or may not access. It is also the standard mechanism for allowing or blocking modern AI crawlers used by training pipelines and answer engines.
Sitemap Test
83% of top 100 sites passed
This website has a sitemap file.
Looks for an XML sitemap on the site and reports whether one is published. Sitemaps give search engines an explicit, machine-readable list of the URLs you want crawled, along with metadata such as last-modified dates, which speeds up discovery of new and updated pages. They are especially useful for large sites or those with weak internal linking.
Image Alt Test
78% of top 100 sites passed
All "img" tags from this webpage have the required "alt" attribute.
Inspects whether images on the page include descriptive alt attributes. Alt text provides accessibility for screen readers, a fallback when images fail to load, and a textual signal that helps search engines understand image content. It also improves how AI crawlers and image search tools interpret and surface the visuals.
Responsive Image Test
29% of top 100 sites passed
Not all images in this webpage are properly sized! This webpage is serving images that are larger than needed for the size of the user's viewport.

Responsive Image Test

How to pass this test?

This test fails when one or more images on the page are served at dimensions significantly larger than the size at which the browser actually renders them. Fixing this issue means resizing the source files (or serving responsive variants) so the bytes downloaded match the pixels actually displayed. The result is faster page loads, lower data usage, and better Core Web Vitals scores.

Example

<img
  src="/images/hero-800.jpg"
  srcset="/images/hero-400.jpg 400w,
          /images/hero-800.jpg 800w,
          /images/hero-1600.jpg 1600w"
  sizes="(max-width: 640px) 100vw, 800px"
  alt="Marathon runners at sunrise"
  width="800" height="450">

Where to make the change

  • Raw HTML: use srcset and sizes to let the browser pick the right variant for the user's viewport. Always include intrinsic width and height attributes.
  • WordPress: WordPress generates multiple image sizes automatically. Use the the_post_thumbnail() helper or the block editor's image block, both of which emit responsive srcset markup.
  • Shopify: use the image_url Liquid filter with size parameters (for example {{ image | image_url: width: 800 }}) and pair with image_tag to emit a responsive image.
  • Wix or Squarespace: both platforms generate responsive variants automatically; this issue is typically caused by uploading a deliberately oversized image.
  • Headless or framework sites: use the framework's image component (for example next/image or astro:assets), which generates responsive variants and lazy-loads off-screen images.

Common causes and how to resolve them

  • Original camera or stock-photo file uploaded as-is: a 6000-pixel-wide JPEG rendered in a 400-pixel column wastes most of the bytes. Resize the source or generate responsive variants.
  • No srcset: the browser has no choice but to use the single source. Add multiple variants so mobile users get smaller files.
  • Hero images sized for ultra-wide displays: if your largest layout is 1600 pixels, do not ship a 4000-pixel original.
  • Background images set in CSS without responsive sources: use the image-set() CSS function or media queries to swap in different image files at different breakpoints.

Best practices

  • Generate variants at common widths: 400, 800, 1200, and 1600 pixels covers most viewports cleanly.
  • Always set width and height: intrinsic dimensions let the browser reserve space and avoid layout shift, helping CLS.
  • Lazy-load off-screen images: add loading="lazy" to images below the fold so the browser only downloads them when needed.
  • Pair with modern formats: resizing alone is good; resizing and serving WebP or AVIF compounds the savings.
Compares the natural dimensions of each image to the size at which it is actually rendered in the user's viewport. Serving images significantly larger than needed wastes bandwidth, slows page load, and forces the browser to scale assets unnecessarily, all of which hurt performance and user experience.
Image Aspect Ratio Test
75% of top 100 sites passed
Not all image display dimensions match the natural aspect ratio! Fix aspect ratio issues to avoid distorted images on this website!

Image Aspect Ratio Test

How to pass this test?

This test fails when one or more images are rendered at an aspect ratio meaningfully different from the source file's native ratio, producing stretched or squashed visuals. Fixing this issue means either using width and height attributes that match the file's real dimensions or replacing the source with a correctly proportioned crop.

Example

<!-- Source file is 1600 x 900 (16:9). Set matching attributes: -->
<img src="/images/marathon-1600.jpg"
     alt="Marathon runners at sunrise"
     width="1600" height="900"
     style="max-width: 100%; height: auto;">

Where to make the change

  • Raw HTML and CSS: set the width and height attributes to the source file's native dimensions. Use CSS height: auto when scaling responsively so the browser preserves the ratio.
  • WordPress: when inserting an image via the block editor, choose the image's intended size rather than overriding dimensions in custom CSS.
  • Shopify, Wix, or Squarespace: use the platform's built-in image cropper so the displayed crop matches the source file you upload.
  • Headless or framework sites: components like next/image require both width and height, which prevents distortion when the layout scales.

Common causes and how to resolve them

  • Hard-coded width and height that do not match the file: recompute them from the source dimensions or remove them and rely on the file's intrinsic ratio.
  • Container has a fixed height that crops the image: use CSS object-fit: cover if cropping is intentional, or change the container so the image keeps its natural ratio.
  • Wrong source file uploaded: swap in a correctly proportioned crop rather than stretching the wrong file in CSS.

Best practices

  • Always set both width and height: the browser uses these to reserve space and avoid layout shift before the image loads, which helps CLS.
  • Use object-fit when cropping is intentional: cover fills the container without distortion; contain letterboxes to preserve the full image.
  • Standardize on a few aspect ratios: picking one or two ratios per template makes it easier to crop assets consistently and avoid one-off distortions.
Compares each image's natural aspect ratio against the ratio at which it is displayed on the page. Significant mismatches result in stretched or squashed visuals that look unprofessional and degrade the user experience.
Deprecated HTML Tags Test
94% of top 100 sites passed
This webpage does not use HTML deprecated tags.
Scans the markup for HTML elements that are no longer part of the modern HTML specification. Deprecated tags may still render today, but browsers can drop support at any time, leading to broken layouts and rendering inconsistencies. Replacing them with current standards keeps the page resilient and easier to maintain.
Google Analytics Test
72% of top 100 sites passed
A Google Analytics script is not detected on this page. While there are several tools available to monitor your site's visitors and traffic sources, Google Analytics is a free, commonly recommended program to help diagnose potential SEO issues.

Google Analytics Test

How to pass this test?

Google Analytics 4 is a free measurement platform that records visitor behavior, traffic sources, and conversion data. Installing it does not directly affect rankings, but the data it produces is essential for measuring SEO performance, identifying high-value pages, and prioritizing future optimization work. Fixing this issue means installing the GA4 tag site-wide and confirming events appear in your reports.

Example

<!-- Place inside <head> on every page -->
<script async src="https://www.googletagmanager.com/gtag/js?id=G-XXXXXXXXXX"></script>
<script>
  window.dataLayer = window.dataLayer || [];
  function gtag(){dataLayer.push(arguments);}
  gtag('js', new Date());
  gtag('config', 'G-XXXXXXXXXX');
</script>

Where to make the change

  • Raw HTML: paste the GA4 snippet into the <head> of every page. A shared layout file is the cleanest place.
  • WordPress: use a site-kit or analytics plugin, or paste the snippet into your theme's header file. Avoid duplicating the tag across multiple plugins.
  • Shopify: add the GA4 measurement ID under Online Store, Preferences, Google Analytics, or install the official Google channel app.
  • Wix or Squarespace: both platforms offer a GA4 measurement ID field in their analytics settings panel.
  • Headless or framework sites: install via Google Tag Manager or use the framework's analytics integration so the tag fires on every route change.

Common causes and how to resolve them

  • Tag not installed at all: install GA4 using the snippet above or the platform-specific path.
  • Universal Analytics tag still in place: Universal Analytics stopped processing data on July 1, 2024. Replace any UA tag (UA-...) with a GA4 measurement ID (G-...).
  • Tag fires only on the homepage: ensure the snippet is in a shared template loaded by every page, not pasted into one post.
  • Cookie banner blocks the tag before consent: integrate Consent Mode v2 so GA4 receives anonymized signals before consent and full data after.
  • Tag duplicated: two snippets on the same page double-count sessions. Audit with the Tag Assistant browser extension and remove duplicates.

Best practices

  • Verify with real-time reports: after installing, open GA4's Realtime view and load the site to confirm events arrive.
  • Use Google Tag Manager: for any site beyond the simplest, GTM gives you a single place to manage analytics, conversion tags, and third-party scripts without code changes.
  • Configure key events: mark conversions (purchase, lead, signup) as key events so reports highlight what matters for SEO ROI.
  • Link to Search Console: connecting GA4 to Search Console surfaces organic queries alongside on-site behavior in the same reports.
Detects whether the page is instrumented with Google Analytics tracking code. Analytics is not an SEO ranking factor, but having reliable traffic and behavior data is essential for measuring the impact of SEO work and identifying opportunities for improvement.
Favicon Test
100% of top 100 sites passed
This website either doesn't have a favicon or this has not been referenced correctly!

Favicon Test

How to pass this test?

A favicon is the small icon associated with the site, shown in browser tabs, bookmarks, history listings, and increasingly in search engine results. Fixing this issue means publishing a favicon at the conventional location and declaring it in the page <head> so browsers and search engines can find and display it.

Example

<head>
  <link rel="icon" href="/favicon.ico" sizes="any">
  <link rel="icon" href="/favicon.svg" type="image/svg+xml">
  <link rel="apple-touch-icon" href="/apple-touch-icon.png">
</head>

Where to make the change

  • Raw HTML: upload favicon.ico to the site root and add the <link rel="icon"> tags in the <head>.
  • WordPress: upload the icon under Appearance, Customize, Site Identity, Site Icon. WordPress will emit the correct link tags.
  • Shopify: upload the icon under Online Store, Themes, Customize, Theme settings, Favicon.
  • Wix or Squarespace: both expose a favicon upload field in the site or design settings.
  • Headless or framework sites: place the favicon files in the public or static directory so they ship at the root paths.

Common causes and how to resolve them

  • No favicon at the root: add at least /favicon.ico. Most browsers fall back to fetching this path even when no link tag is present.
  • Wrong MIME type: if the favicon is served as text/html instead of image/x-icon or image/svg+xml, browsers will not render it. Check the response in the network tab.
  • Cached old icon after replacement: browsers cache favicons aggressively. Append a query string (?v=2) to bust the cache.
  • Missing high-resolution variants: modern devices need 180 x 180 (Apple), 192 x 192 (Android), and 512 x 512 (PWA) sizes for crisp rendering.

Best practices

  • Provide an SVG version: SVG favicons scale crisply at any size and support light or dark scheme variants.
  • Include an Apple touch icon: a 180 x 180 PNG named apple-touch-icon.png at the root makes the site look correct when added to an iOS home screen.
  • Use a consistent visual identity: the favicon should match the brand mark so users recognize the site at a glance in tabs and bookmarks.
  • Test in both light and dark mode: some browsers render the tab background differently. Make sure the icon stays legible in both.
Verifies whether the site declares a favicon and that it loads correctly. Favicons appear in browser tabs, bookmarks, and increasingly in search engine result pages, where they reinforce brand recognition and make a listing easier to spot at a glance.
JS Error Test
83% of top 100 sites passed
There are no severe JavaScript errors on this webpage.
Inspects the page for JavaScript runtime errors that occur as it loads. Unhandled errors can break interactive features, leave content unrendered, and signal poor code quality, all of which hurt the user experience that search engines factor into rankings.
Console Errors Test
27% of top 100 sites passed
This webpage has some errors caught by the Chrome DevTools Console!

Console Errors Test

How to pass this test?

Console errors include any unhandled JavaScript exceptions, network request failures, security warnings, or deprecation notices the browser emits while loading the page. Fixing this issue means resolving the underlying problem each error reports rather than suppressing the message. Even errors that do not visibly break the page can degrade performance, leak data, or trip Core Web Vitals.

Where to make the change

  • Open DevTools, Console tab: expand each entry to see the file, line, and stack trace. Right-click an entry to filter, save, or jump to the source.
  • Application code: patch the offending script (see js-errors). For network failures, fix the failing endpoint or remove the stale request.
  • Third-party tags: if the error originates in an analytics, ad, or widget script, update the snippet, switch to the vendor's current loader, or remove unused tags.

Common causes and how to resolve them

  • JavaScript runtime errors: see the JS Error Test fix; the same approach applies.
  • Failed network requests (404 or 5xx): remove the dead request or fix the endpoint. Stale tracking pixels and removed assets are common culprits.
  • Mixed content warnings: the page is HTTPS but loads an HTTP resource. Update the resource URL to https://.
  • CORS or CSP violations: tighten or expand the policy as appropriate. CSP errors usually require allowlisting the offending origin in the response header.
  • Deprecation warnings: update the call site to use the recommended API. These do not break the page today but will when the deprecation cycle completes.

Best practices

  • Treat the console as a build artifact: a clean console is a sign of a healthy page. Aim for zero errors and zero warnings on production routes.
  • Use error monitoring in production: real users hit edge cases your local environment will never reproduce. A monitoring service surfaces them with frequency data.
  • Defer or remove unused third-party scripts: every removed script is one fewer source of console noise.
Reviews the browser console for warnings and errors emitted while the page loads. Console messages often expose underlying issues such as failed network requests, deprecated APIs, or security warnings that can quietly degrade the experience even when the page appears to work.
Charset Declaration Test
96% of top 100 sites passed
This webpage has a character encoding declaration.
Content-Type: text/html; charset=UTF-8
Checks whether the page declares a character encoding such as UTF-8. Without an explicit charset declaration, browsers must guess the encoding, which can lead to garbled symbols, broken accented characters, and inconsistent rendering across devices. UTF-8 is the modern standard recommended by Google.

Speed optimizations

Score:52
Failed:9
Warnings:0
Passed:11
HTML Page Size Test
23% of top 100 sites passed
The size of this webpage's HTML is 39.38 Kb, and is greater than the average size of 33 Kb! This can lead to slower loading times, lost visitors, and decreased revenue. Good steps to reduce HTML size include: using HTML compression, CSS layouts, external style sheets, and moving javascript to external files.

HTML Page Size Test

How to pass this test?

This test fails when the raw HTML document weighs significantly more than necessary, even before counting images, CSS, or JavaScript. Bloated HTML increases time to first byte, slows parsing, and stalls rendering on mobile networks and lower-powered devices. Fixing this issue means trimming inline data, removing legacy markup, and keeping the document focused on what the user needs.

Where to make the change

  • Application code or templates: identify which sections produce the most bytes (often a large inline JSON blob, an inline base64 image, or a giant comment block) and refactor them to load externally or be removed.
  • WordPress: check for plugins or page builders that emit large inline configurations. Disable unused plugins and prefer themes that ship clean markup.
  • Shopify: theme code may inline large product or section JSON. Move heavy data to a fetch-on-demand endpoint when possible.
  • Headless or framework sites: review the rendered output for serialized state (for example __NEXT_DATA__ in Next.js) and trim what is sent on first paint by streaming or lazy-loading non-critical chunks.

Common causes and how to resolve them

  • Inline base64 images or fonts: move them to external files so the browser can cache them across requests.
  • Excessive inline CSS or JavaScript: link to external stylesheets and scripts so they cache. Inline only the truly critical CSS for above-the-fold content.
  • Large server-side JSON payloads: ship only the data needed for first render. Fetch the rest on demand.
  • Repeating boilerplate or commented-out code: strip comments and dead code in the production build.
  • HTML compression disabled: Gzip or Brotli compression often shrinks the response by half or more. Confirm the server sends the appropriate Content-Encoding header.

Best practices

  • Aim for under 100 KB of HTML: most pages can comfortably stay under this. Anything beyond a few hundred KB usually indicates structural bloat worth refactoring.
  • Enable compression: Gzip is the safe minimum, Brotli is even better for HTML and other text formats.
  • Defer non-critical content: rendering only what is needed for the initial viewport keeps both bytes and parse time down.
  • Audit periodically: add HTML size to your performance budget so regressions get caught in CI.
Measures the size of the raw HTML document, excluding images and external CSS or JavaScript. Bloated HTML increases time to first byte and parsing time, slowing down rendering on mobile networks and lower-powered devices. Trimming inline styles, redundant markup, and oversized inline data keeps initial load fast.
DOM Size Test
56% of top 100 sites passed
The Document Object Model (DOM) of this webpage has 2,944 nodes which is greater than the recommended value of 1,500 nodes! A large DOM size negatively affects site performance and increases the page load time.

DOM Size Test

How to pass this test?

This test fails when the page builds a Document Object Model with too many nodes or excessive nesting depth. Large DOMs increase memory usage, lengthen style and layout calculations, and slow rendering, particularly on mobile devices. Fixing this issue means simplifying the markup so the browser has less work to do on every interaction.

Where to make the change

  • Application code or templates: identify the heaviest sections (long lists, repeating components, deep grid wrappers) and either paginate them, virtualize them, or flatten the markup.
  • WordPress: heavy page-builder themes often emit deeply nested wrapper divs. Consider switching templates or using a theme that emits cleaner markup.
  • Headless or framework sites: use a virtualized list component for long item lists so only visible rows are rendered into the DOM.

Common causes and how to resolve them

  • Long lists rendered in full: show a paginated subset or virtualize the list so only on-screen items exist in the DOM.
  • Excessive wrapper divs: a stack of layout wrappers ten deep can usually be flattened to two or three with modern CSS layouts (Grid, Flexbox).
  • Hidden modals and dropdowns kept in the DOM: render them on demand instead of always emitting them with display: none.
  • Third-party widget injecting many nodes: a chat widget or carousel may add hundreds of nodes per page. Lazy-load it after main content renders.

Best practices

  • Aim for under 1500 nodes total and a maximum depth of 32: Lighthouse uses these as warning thresholds and they correlate with smooth rendering on mid-tier mobile devices.
  • Render only what is visible: long lists, accordions, and modals belong outside the initial DOM until needed.
  • Prefer flat semantic markup: a single <article> with a few children is faster than a deeply nested <div> tree.
  • Audit with Lighthouse: the DOM size audit reports the worst-offending elements, which often points at a single template that needs rework.
Measures the size and depth of the page's Document Object Model, the tree of nodes the browser builds from the HTML. Very large DOMs increase memory usage, lengthen style and layout calculations, and slow down rendering, particularly on mobile devices. Keeping the DOM lean improves both load time and runtime responsiveness.
HTML Compression/GZIP Test
99% of top 100 sites passed
This webpage is successfully compressed using gzip compression on your code. The HTML code is compressed from 376.89 Kb to 39.38 Kb (90% size savings). This helps ensure a faster loading webpage and improved user experience.
Verifies whether the server delivers the HTML using a compression algorithm such as Gzip or Brotli. Compressed responses dramatically reduce transfer size with negligible decompression cost, translating directly into faster page loads, especially on slower connections.
Site Loading Speed Test
71% of top 100 sites passed
The loading time of this webpage (measured from N. Virginia, US) is around 6.75 seconds and is greater than the average loading speed which is 5 seconds!
Related Keywords

Accurate historical loading speed monitor and reports

Get detailed and accurate loading speed reports for your websites and see how your pages are being loaded over time.

Measures the overall time required to load the page in the browser. Page speed is a confirmed Google ranking factor and a strong driver of bounce rate, with slower pages losing a meaningful share of users before they even see the content. Faster pages also tend to convert better, making this a key metric for both SEO and revenue.
JS Execution Time Test
53% of top 100 sites passed
The JavaScript code used by this webpage is executed in less than 2 seconds.
Reports the total time the browser spends parsing, compiling, and executing JavaScript while the page loads. Heavy JavaScript work blocks the main thread and is the primary cause of poor Interaction to Next Paint, the Core Web Vital that replaced First Input Delay in 2024 and that Google uses as part of its ranking algorithms. Reducing bundle size and deferring non-critical scripts directly improves perceived performance.
Page Objects Test
7% of top 100 sites passed
This webpage is using more than 20 http requests, which can slow down page loading and negatively impact user experience!
Content size by content type
Content type
Percent
Size
image
87.3 %
813.16 Kb
font
5.1 %
47.52 Kb
html
4.2 %
39.21 Kb
css
2.6 %
23.90 Kb
javascript
0.9 %
8.11 Kb
other
0.0 %
0 B
TOTAL
100%
931.91 Kb
Requests by content type
Content type
Percent
Requests
image
67.9 %
19
javascript
14.3 %
4
css
10.7 %
3
html
3.6 %
1
font
3.6 %
1
other
0.0 %
0
TOTAL
100%
28
Content size by domain
Domain
Percent
Size
ezzetv.co.uk
100.0 %
931.91 Kb
TOTAL
100%
931.91 Kb
Requests by domain
Domain
Percent
Requests
ezzetv.co.uk
100.0 %
28
TOTAL
100%
28
Verifies that every resource the page requests, including images, scripts, stylesheets, and fonts, can be successfully retrieved. Broken or unreachable assets can leave the page rendered incorrectly, trigger console errors, and damage both user experience and how search engines perceive page quality.
CDN Usage Test
95% of top 100 sites passed
This webpage is not serving resources (images, javascript and css) from CDNs!

CDN Usage Test

How to pass this test?

A Content Delivery Network serves static assets from edge locations close to the user, reducing latency, improving cache hit rates, and offloading traffic from the origin server. Fixing this issue means routing your images, JavaScript, CSS, and fonts through a CDN so visitors anywhere in the world get fast, consistent delivery.

Where to make the change

  • Cloud platforms: Cloudflare, Fastly, AWS CloudFront, Bunny.net, and similar providers offer free or low-cost CDN tiers. Sign up, point your domain through the CDN, and enable caching for static asset paths.
  • WordPress: use a CDN integration plugin or sign up directly with Cloudflare and update the site's nameservers.
  • Shopify: Shopify serves storefront assets through its own CDN automatically; the failure usually points at custom assets uploaded outside the platform.
  • Headless or framework sites: deploying to Vercel, Netlify, or Cloudflare Pages puts the entire site behind a global CDN by default.

Common causes and how to resolve them

  • No CDN at all: add one. Even a free Cloudflare account in front of an existing host produces measurable speed gains.
  • CDN configured but bypassed for some assets: ensure all img, script, link, and font URLs use the CDN hostname rather than the origin.
  • Cache headers prevent caching: long-lived assets need cache-control headers like public, max-age=31536000, immutable. Without them, the CDN cannot cache effectively.
  • Origin-only third-party scripts: many vendors already serve their scripts via their own CDN. Use the URL the vendor provides rather than self-hosting.

Best practices

  • Use a versioned asset path: filenames like app.a3f9.css let you set far-future cache headers without ever serving stale files. Update the filename when content changes.
  • Enable Brotli at the edge: most CDNs can compress responses on the fly, including text formats.
  • Pre-warm caches for new launches: after a major release, request key URLs through every region (or use the CDN's purge-and-prefetch tools) so users do not hit cold caches.
Detects whether static assets such as images, JavaScript, and CSS are delivered through a Content Delivery Network. CDNs serve files from edge locations close to the user, reducing latency, improving cache hit rates, and offloading traffic from the origin server. The result is faster, more consistent page performance worldwide.
Modern Image Format Test
43% of top 100 sites passed
This webpage is using images in a modern format.
Identifies images served in legacy formats such as JPEG and PNG instead of modern alternatives like WebP or AVIF. Modern formats compress significantly better at equivalent visual quality, which means smaller transfers, faster page loads, and lower data usage for visitors on metered connections.
Image Metadata Test
72% of top 100 sites passed
This webpage is not using images with large metadata.
Flags images carrying disproportionately large embedded metadata such as EXIF data, thumbnails, color profiles, geolocation, and camera information. This metadata is rarely useful on the web and adds bytes to every request without any rendering benefit, making it an easy win for shrinking image payloads.
Image Caching Test
95% of top 100 sites passed
This website is using cache headers for images and the browsers will display these images from the cache.
Inspects whether image responses include caching headers that allow browsers to store them for repeat visits. With proper caching directives, returning visitors retrieve images from the local cache instead of refetching them, producing noticeably faster subsequent page loads.
JavaScript Caching Test
96% of top 100 sites passed
This webpage is using cache headers for all JavaScript resources.
Inspects whether external JavaScript files are served with caching headers that allow browsers to store and reuse them. Cached scripts skip the network on repeat visits, reducing load time and bandwidth for returning users without sacrificing the ability to push fresh code by versioning file URLs.
CSS Caching Test
98% of top 100 sites passed
This webpage is using cache headers for all CSS resources.
Inspects whether external CSS files are served with caching headers that allow browsers to store and reuse them. Cached stylesheets skip the network on repeat visits, reducing load time for returning users while still allowing updates through versioned filenames.
JavaScript Minification Test
98% of top 100 sites passed
All JavaScript files used by this webpage are minified.
Detects whether external JavaScript files are minified by stripping whitespace, comments, and shortening identifiers. Minified scripts are substantially smaller and faster to download and parse, which lowers page load time and improves Core Web Vitals scores.
CSS Minification Test
100% of top 100 sites passed
All CSS resources used by this webpage are minified.
Detects whether external CSS files are minified by removing whitespace, comments, and unused characters. Minification reduces stylesheet size with no functional change, leading to faster downloads and quicker first render.
Render Blocking Resources Test
15% of top 100 sites passed
This webpage is using render blocking resources! Eliminating render-blocking resources can help this webpage to load significantly faster and will improve the website experience for your visitors.

Render Blocking Resources Test

How to pass this test?

This test fails when JavaScript or CSS resources block the browser from rendering visible content. Each render-blocking file delays the first paint, and on slower networks the cumulative impact can be severe. Fixing this issue means inlining the truly critical CSS, deferring or asynchronously loading non-essential scripts, and removing unused code.

Example

<head>
  <!-- Inline only above-the-fold critical CSS -->
  <style>/* critical styles here */</style>

  <!-- Load full stylesheet asynchronously -->
  <link rel="preload" href="/styles/main.css" as="style"
        onload="this.onload=null;this.rel='stylesheet'">

  <!-- Defer non-critical scripts -->
  <script src="/scripts/app.js" defer></script>
</head>

Where to make the change

  • Application code or templates: identify the CSS and JavaScript needed for the initial render and load only those synchronously. Defer the rest.
  • Build pipeline: use a critical CSS extractor (such as critical or penthouse) to generate the above-the-fold styles automatically.
  • WordPress: performance plugins offer "delay JS execution" and "load CSS asynchronously" options that handle most of this without code changes.
  • Headless or framework sites: use the framework's preload and code-splitting hints to control what blocks rendering.

Common causes and how to resolve them

  • Single large stylesheet blocking render: inline critical CSS for the first viewport, load the full stylesheet asynchronously.
  • Synchronous third-party scripts in the head: add defer or async, or move them to the end of the body.
  • Web fonts blocking text rendering: add font-display: swap in @font-face rules so the fallback font shows immediately.
  • Render-blocking @import in CSS: replace with separate <link rel="stylesheet"> tags so the browser can fetch them in parallel.

Best practices

  • Use defer for scripts that need the DOM: they execute after parsing but before DOMContentLoaded.
  • Use async for fully independent scripts: they execute as soon as they download, in any order.
  • Preload the critical request chain: tell the browser early about fonts and key assets with <link rel="preload">.
  • Audit with Lighthouse: the Render-blocking resources audit lists every offending file with the estimated time saved by deferring it.
Identifies JavaScript and CSS resources that the browser must download and process before it can render visible content. Each render-blocking file delays the first paint, and on slower networks the cumulative impact can be severe. Inlining critical styles, deferring non-essential scripts, and removing unused code all help unblock the rendering path.
URL Redirects Test
97% of top 100 sites passed
This URL doesn't have any redirects (which could potentially cause site indexation issues and site loading delays).
Counts the number of HTTP redirects required for the URL to resolve to its final destination. Each hop adds latency and can dilute link equity, while long redirect chains sometimes confuse crawlers and indexing pipelines. Keeping redirects short and direct is a Google recommendation for both performance and SEO.
Time To First Byte Test
99% of top 100 sites passed
The Time To First Byte value of this webpage is 3.778 seconds. To provide a good user experience, Google recommends that sites should strive to have a TTFB of 0.8 seconds or less.
3.778 s
0.8 s
1.8 s

Time To First Byte Test

How to pass this test?

Time to First Byte (TTFB) measures the delay between the browser requesting the page and the first byte of the response arriving. TTFB reflects backend, network, and CDN performance and effectively sets the floor for every other loading metric, since rendering cannot begin until bytes start flowing. Fixing this issue usually means improving server response time, adding edge caching, or reducing redirect chains.

Where to make the change

  • Server and hosting: upgrade to a faster host plan, move to a region closer to your users, and enable HTTP/2 or HTTP/3.
  • CDN: putting the site behind a CDN dramatically reduces TTFB for users far from the origin server. Cache HTML responses at the edge whenever possible.
  • Application code: profile slow endpoints, cache expensive database queries and external API calls, and use streaming or partial responses.

Common causes and how to resolve them

  • Slow server processing: profile the slowest controllers or routes. Database queries, N+1 loops, and synchronous third-party API calls are typical culprits.
  • No edge caching: caching HTML at the CDN reduces TTFB to a single edge round trip. Use rules to bypass cache for logged-in users.
  • Long redirect chains: each hop adds latency before bytes flow. Collapse chains so the URL the user requests resolves to its final destination in one step.
  • Origin in a distant region: a US-only origin makes Asian users wait. Add edge regions or move the origin closer to the audience.
  • HTTP/1.1 or no keep-alive: upgrading to HTTP/2 or HTTP/3 reduces connection setup overhead.

Best practices

  • Target sub-800 millisecond TTFB at the 75th percentile: Google's recommended threshold for a "good" experience.
  • Cache aggressively: the cheapest server work is the work you never do. Static and semi-static pages should be served from cache.
  • Use HTTP/3 where supported: it eliminates head-of-line blocking and reduces handshake latency, especially on mobile networks.
  • Stream the response when possible: sending the head before the rest of the body lets the browser start fetching subresources earlier.
Measures Time to First Byte, the delay between the browser requesting the page and the first byte of the response arriving. TTFB reflects backend, network, and CDN performance and effectively sets the floor for every other loading metric, since rendering cannot begin until bytes start flowing. Sustained high TTFB usually points to slow server processing, missing edge caching, or inefficient redirects.
First Contentful Paint Test
90% of top 100 sites passed
The First Contentful Paint value of this webpage is 6.452 seconds. To provide a good user experience, Google recommends that sites should strive to have a First Contentful Paint value of 1.8 seconds or less.
6.452 s
1.8 s
3 s

First Contentful Paint Test

How to pass this test?

First Contentful Paint (FCP) measures the time from when the page starts loading to when any part of its content is rendered on the screen. FCP is the user's first visual confirmation that the page is loading, and faster values are strongly correlated with lower bounce rates and better Core Web Vitals scores. Fixing this issue means reducing time to first byte, eliminating render-blocking resources, and serving above-the-fold content without delay.

Where to make the change

  • Server and CDN: reduce TTFB so the browser receives bytes sooner. Edge caching for HTML produces dramatic FCP wins.
  • Application code or templates: inline the critical CSS for above-the-fold content and defer everything not needed for the first paint.
  • Build pipeline: ensure JavaScript bundles are split so the initial load only includes what is needed for first render.

Common causes and how to resolve them

  • Slow TTFB: address the underlying server, redirect, or hosting issue (see Time to First Byte fix).
  • Render-blocking CSS: inline the critical CSS for the first viewport, load the full stylesheet asynchronously.
  • Render-blocking JavaScript in the head: add defer or move scripts to the end of the body.
  • Web fonts delaying text rendering: add font-display: swap so a fallback font is shown immediately while the custom font loads.
  • Heavy hero image without prioritization: add fetchpriority="high" to the hero image and <link rel="preload"> for it in the head.

Best practices

  • Target sub-1.8 second FCP at the 75th percentile: Google's recommended threshold for a "good" experience.
  • Inline critical CSS: the styles needed for the first viewport should not require an extra network round trip.
  • Preload key resources: hero image, key fonts, and critical scripts benefit from explicit preload hints.
  • Defer non-critical work: analytics, chat widgets, and below-the-fold content can wait until after first paint.
Measures First Contentful Paint, the moment when the browser renders the first piece of visible content from the DOM, such as text, an image, or an SVG. FCP is the first signal to the user that the page is actually loading, and faster values are strongly correlated with lower bounce rates and better Core Web Vitals scores.
Largest Contentful Paint Test
77% of top 100 sites passed
The Largest Contentful Paint duration of this webpage is 6.45 seconds. To provide a good user experience, Google recommends that sites should strive to have Largest Contentful Paint of 2.5 seconds or less.
6.45 s
2.5 s
4 s
Largest Contentful Paint element within the viewport:
Text: The Go-To IPTV in the UK — Smooth 4K Streaming With No Buffering
Html: <h1 class="text-3xl sm:text-4xl md:text-5xl lg:text-5xl font-...">

Largest Contentful Paint Test

How to pass this test?

Largest Contentful Paint (LCP) measures when the largest visible element in the viewport, such as a hero image or main heading, finishes rendering. LCP is one of Google's Core Web Vitals and a direct ranking factor, used as a proxy for when the user perceives the page as effectively loaded. Fixing this issue means identifying the LCP element and ensuring it loads as early as possible.

Where to make the change

  • Identify the LCP element: open Chrome DevTools, run a Performance trace, and find the LCP marker. The element it points at is the one to optimize.
  • Application code or templates: preload the LCP image, give it fetchpriority="high", and ensure it is in the initial HTML rather than injected by JavaScript.
  • Server and CDN: reduce TTFB and ensure the LCP image is served from a fast, geographically close origin.

Common causes and how to resolve them

  • Hero image loaded lazily: remove loading="lazy" from the LCP image; it should load eagerly.
  • LCP image not preloaded: add <link rel="preload" as="image" href="/hero.jpg" fetchpriority="high"> in the head so the browser fetches it before parsing the rest of the document.
  • LCP image too large or in legacy format: resize to displayed dimensions and serve as WebP or AVIF.
  • Slow TTFB or render-blocking resources: address the underlying TTFB and render-blocking issues; LCP cannot be fast if the page itself is slow to start.
  • Client-side rendered hero content: server-render or pre-render the LCP element so it appears in the initial HTML.
  • Web fonts delaying LCP text: use font-display: swap so the LCP heading renders immediately in a fallback font.

Best practices

  • Target sub-2.5 second LCP at the 75th percentile: the official Core Web Vitals threshold for a "good" experience.
  • Preload the LCP image: the single highest-impact LCP optimization on most sites.
  • Use fetchpriority="high": tells the browser to prioritize the resource ahead of others.
  • Ship modern image formats: AVIF and WebP cut hero image bytes substantially, which directly lowers LCP.
Measures Largest Contentful Paint, the time at which the largest visible element in the viewport, such as a hero image or main heading, finishes rendering. LCP is one of Google's Core Web Vitals and a direct ranking factor, used as a proxy for when the user perceives the page as effectively loaded.
Cumulative Layout Shift Test
91% of top 100 sites passed
The CLS score of this webpage is 0.0002. To provide a good user experience, Google recommends that sites should strive to have a CLS score of 0.1 or less.
0.0002
0.1
0.25
DOM element which contributes the most to CLS score:
Score: 0.0002
Measures Cumulative Layout Shift, the total amount that visible elements move around unexpectedly while the page loads. Layout shifts cause users to misclick and feel the page is unstable, and CLS is one of Google's Core Web Vitals and a direct ranking factor. Common causes include images without explicit dimensions, late-loading fonts, and aggressively injected overlays such as cookie consent banners.

Server and security

Score:95
Failed:1
Warnings:0
Passed:6
URL Canonicalization Test
93% of top 100 sites passed
Detects whether different URL variants of the site, such as the apex domain and the www subdomain or HTTP and HTTPS, all resolve consistently to a single canonical version. When the same content is reachable at multiple URLs without proper redirects, search engines may split ranking signals across the variants and become unsure which one to index.
SSL Checker and HTTPS Test
100% of top 100 sites passed
This website is successfully using HTTPS, a secure communication protocol over the Internet.
The certificate is not used before the activation date.
The certificate has not expired.
The hostname "ezzetv.co.uk" is correctly listed in the certificate.
The certificate should be trusted by all major web browsers.
The certificate was not revoked.
The certificate was signed with a secure hash.
Certificate Chain:
Server certificate
Common Name
ezzetv.co.uk
Subject Alternative Names
*.ezzetv.co.uk, ezzetv.co.uk
Not Valid Before
Tue, August 25, 2026 at 2:09:41 AM UTC
Not Valid After
Mon, November 23, 2026 at 2:09:40 AM UTC
Signature Algorithm
ecdsaWithSha384
Issuer
YE2
Intermediate certificate
Common Name
YE2
Organization
Let's Encrypt
Location
US
Not Valid Before
Wed, September 3, 2025 at 12:00:00 AM UTC
Not Valid After
Sat, September 2, 2028 at 11:59:59 PM UTC
Signature Algorithm
ecdsaWithSha384
Issuer
Root YE
Intermediate certificate
Common Name
Root YE
Organization
ISRG
Location
US
Not Valid Before
Wed, May 13, 2026 at 12:00:00 AM UTC
Not Valid After
Thu, September 2, 2032 at 11:59:59 PM UTC
Signature Algorithm
ecdsaWithSha384
Issuer
ISRG Root X2
Root certificate
Common Name
ISRG Root X2
Organization
Internet Security Research Group
Location
US
Not Valid Before
Fri, September 4, 2020 at 12:00:00 AM UTC
Not Valid After
Mon, September 17, 2040 at 4:00:00 PM UTC
Signature Algorithm
ecdsaWithSha384
Issuer
ISRG Root X2
Verifies whether the site is served over HTTPS with a valid TLS certificate. HTTPS encrypts the connection between visitor and server, protecting credentials and other sensitive data in transit, and Google has used it as a positive ranking signal since 2014. Modern browsers also flag non-HTTPS pages as Not Secure, which damages user trust.
Mixed Content Test (HTTP over HTTPS)
100% of top 100 sites passed
This webpage does not use mixed content - both the initial HTML and all other resources are loaded over HTTPS.
Detects whether a page served over HTTPS is loading any sub-resources such as images, scripts, or stylesheets over insecure HTTP. Mixed content weakens the security guarantees of HTTPS, and modern browsers either block the resources outright or warn the user, often breaking the page in the process.
HTTP2 Test
99% of top 100 sites passed
This webpage is using the HTTP/2 protocol.
Verifies whether the page and its resources are delivered over HTTP/2 or newer, rather than the legacy HTTP/1.1 protocol. HTTP/2 introduces multiplexing, header compression, and prioritization, which together reduce latency and allow the browser to load many resources from the same origin far more efficiently.
HSTS Test
84% of top 100 sites passed
This webpage is not using the Strict-Transport-Security header! This is a security header that was created as a way to force the browser to use secure connections when a site is running over HTTPS.

HSTS Test

How to pass this test?

The Strict-Transport-Security (HSTS) response header tells browsers to access the site only over HTTPS, automatically upgrading future requests and refusing to fall back to HTTP. Fixing this issue means configuring the server to send the header on every HTTPS response.

Example

Strict-Transport-Security: max-age=31536000; includeSubDomains; preload

Where to make the change

  • Server configuration: add the header in Nginx (add_header Strict-Transport-Security "max-age=31536000; includeSubDomains" always;), Apache (Header always set Strict-Transport-Security ...), or your application's response middleware.
  • CDN: Cloudflare, Fastly, and CloudFront let you set HSTS at the edge so it applies regardless of origin configuration.
  • Cloud platforms: Netlify and Vercel allow HSTS via headers files (_headers on Netlify, vercel.json on Vercel).

Common causes and how to resolve them

  • Header not sent: add it in the server or CDN config. Confirm in DevTools, Network tab.
  • Header sent only on HTTP responses: HSTS is only honored over HTTPS, so the header must accompany the HTTPS response.
  • Short max-age: a max-age below a few months provides little protection. Bump to a year (31536000) once you are confident HTTPS is stable.
  • includeSubDomains breaking subdomains that lack HTTPS: only add this directive after every subdomain serves HTTPS. Otherwise users will lose access to the HTTP-only ones.

Best practices

  • Start with a short max-age, then ramp up: a one-week max-age lets you back out quickly if something breaks. Increase to a year once stable.
  • Add preload after testing: submit your domain to hstspreload.org so browsers ship with HSTS for your site baked in. Note that removing a preloaded site is slow.
  • Pair with HTTP-to-HTTPS redirects: HSTS only kicks in after a successful HTTPS visit. Until then, redirects do the work.
Checks whether the server sends a Strict-Transport-Security header instructing browsers to only access the site over HTTPS. HSTS protects users from protocol downgrade attacks and accidental exposure to insecure connections, and is a baseline requirement for any site handling sensitive data.
Plaintext Emails Test
97% of top 100 sites passed
This webpage does not include email addresses in plaintext.
Scans the page for email addresses written in plain text. Spambots harvest such addresses to add them to bulk mailing lists, so obfuscating contact emails or replacing them with contact forms helps reduce inbox spam without hiding the address from legitimate visitors.

Mobile usability

Score:100
Failed:0
Warnings:0
Passed:3
Meta Viewport Test
92% of top 100 sites passed
This webpage is using a viewport meta tag.
<meta name="viewport" content="width=device-width, initial-scale=1" />

Checks whether the page declares a viewport meta tag that controls how the layout scales on mobile devices. Without it, mobile browsers render the page at a default desktop width and shrink it to fit, producing unreadable text and unusable touch targets. A correct viewport declaration is the foundation of responsive design.
Media Query Responsive Test
98% of top 100 sites passed
This webpage is using CSS media queries, which is the base for responsive design functionalities.
Detects whether the page's stylesheets use CSS media queries to adapt the layout to different screen sizes. Media queries are the primary mechanism for responsive design, allowing typography, spacing, and component arrangement to adjust gracefully from phones to large desktops. Because Google now indexes the web mobile-first, the responsive mobile layout is effectively the version search engines crawl, evaluate, and rank.
Mobile Snapshot Test
Mobile view
A rendered screenshot of how the page appears on a mobile device. Useful for visually confirming that responsive layouts work as intended and for spotting issues such as overflowing content, illegible text, or broken images that automated checks alone may miss.

Advanced SEO

Score:98
Failed:0
Warnings:1
Passed:8
Structured Data Test
66% of top 100 sites passed
This webpage is using structured data.
Inspects the page for structured data markup such as JSON-LD or Microdata that follows schema.org vocabularies. Structured data helps search engines understand entities and relationships on the page, often unlocking rich result features in SERPs such as star ratings, FAQs, recipes, and product cards. It is also a primary signal AI answer engines use to extract precise facts when generating responses.
Custom 404 Error Page Test
80% of top 100 sites passed
This website is using a custom 404 error page. We recommend to have a custom 404 error page in order to improve the website's user experience by letting users know that only a specific page is missing/broken (and not the entire site), providing them helpful links, the opportunity to report bugs, and potentially track the source of broken links.
Detects whether the site serves a branded, helpful page when a requested URL is not found, instead of the browser's generic error screen. A custom 404 keeps users on the site by offering navigation, search, or suggested links, which reduces frustration and protects engagement metrics that influence both UX perception and indirect SEO outcomes.
Noindex Tag Test
99% of top 100 sites passed
This webpage does not use the noindex meta tag. This means that it can be indexed by search engines.
Detects whether the page is being excluded from search engine indexes via a noindex directive in the robots meta tag or X-Robots-Tag HTTP header. A noindex on the wrong page is one of the most common ways important content silently disappears from search results, so verifying its absence on pages meant to rank is critical.
Canonical Tag Test
93% of top 100 sites passed
This webpage is using the canonical link tag. This tag specifies that the URL: https://ezzetv.co.uk/ is preferred to be used in search results. Please ensure that this specification is correct, as canonical tags are often hard-coded and may not always reflect the latest changes in a site's URL structure.
<link href="https://ezzetv.co.uk/" rel="canonical"/>
Detects whether the page declares a canonical link tag indicating its preferred URL. Canonical tags consolidate ranking signals across duplicate or near-duplicate URLs onto a single authoritative version, which prevents search engines from splitting authority across variants caused by query parameters, session IDs, or alternate paths. They also help AI crawlers identify the source of truth when citing the page.
Nofollow Tag Test
This webpage does not use the nofollow meta tag. This means that search engines will crawl all links from this webpage.
Detects whether the page applies a nofollow directive, either through a robots meta tag, an X-Robots-Tag header, or per-link rel attributes, that tells search engines not to follow outbound links. Google recommends nofollow for sponsored links and for user-generated content where the linked sites are not vetted, so its presence or absence has real consequences for how link equity flows.
Disallow Directive Test
Your robots.txt file includes a disallow command which instructs search engines to avoid certain parts of your website! You are advised to confirm if access to these resources or pages are intended to be blocked (e.g., if they contain internal-only content or sensitive information).
Surfaces the disallow rules declared in the site's robots.txt file. Disallow directives tell search engine crawlers not to access specific files, paths, or directories, which is useful for keeping admin sections and duplicate content out of indexes but dangerous when applied too broadly, since over-blocking can hide important pages from search.
Meta Refresh Test
98% of top 100 sites passed
This webpage is not using a meta refresh tag.
Detects whether the page uses a meta refresh tag to automatically reload or redirect after a delay. Meta refresh is largely obsolete, hurts accessibility by jumping focus and disorienting screen reader users, and is a weaker signal to search engines than a proper server-side 301 redirect. Its presence usually indicates outdated implementation worth updating.
SPF Records Test
94% of top 100 sites passed
This DNS server is using an SPF record.
v=spf1 a mx ip4:185.221.182.25 ~all
Checks the domain's DNS for a Sender Policy Framework record. SPF lets receiving mail servers verify that messages claiming to come from the domain were actually sent by an authorized mail server, which significantly reduces the chance of legitimate email being marked as spam and protects the domain's sender reputation.
Ads.txt Validation Test
67% of top 100 sites passed
This website doesn't use an ads.txt file! Ads.txt is a text file that contains a list of Authorized Digital Sellers. The purpose of ads.txt files is to give advertisers and advertising networks the ability to verify who is allowed to sell advertising on your website.
Validates the format of the site's ads.txt file, which publishers use to declare which advertising vendors are authorized to sell their inventory programmatically. A correctly formatted ads.txt protects against domain spoofing in the ad supply chain and is required for inclusion in many premium advertising marketplaces.

Dominate search today on Google and AI Engines.

Join 85,000+ SaaS Marketers, Growth Agencies, Content-Led Companies and E-commerce Brands.

See Pricing
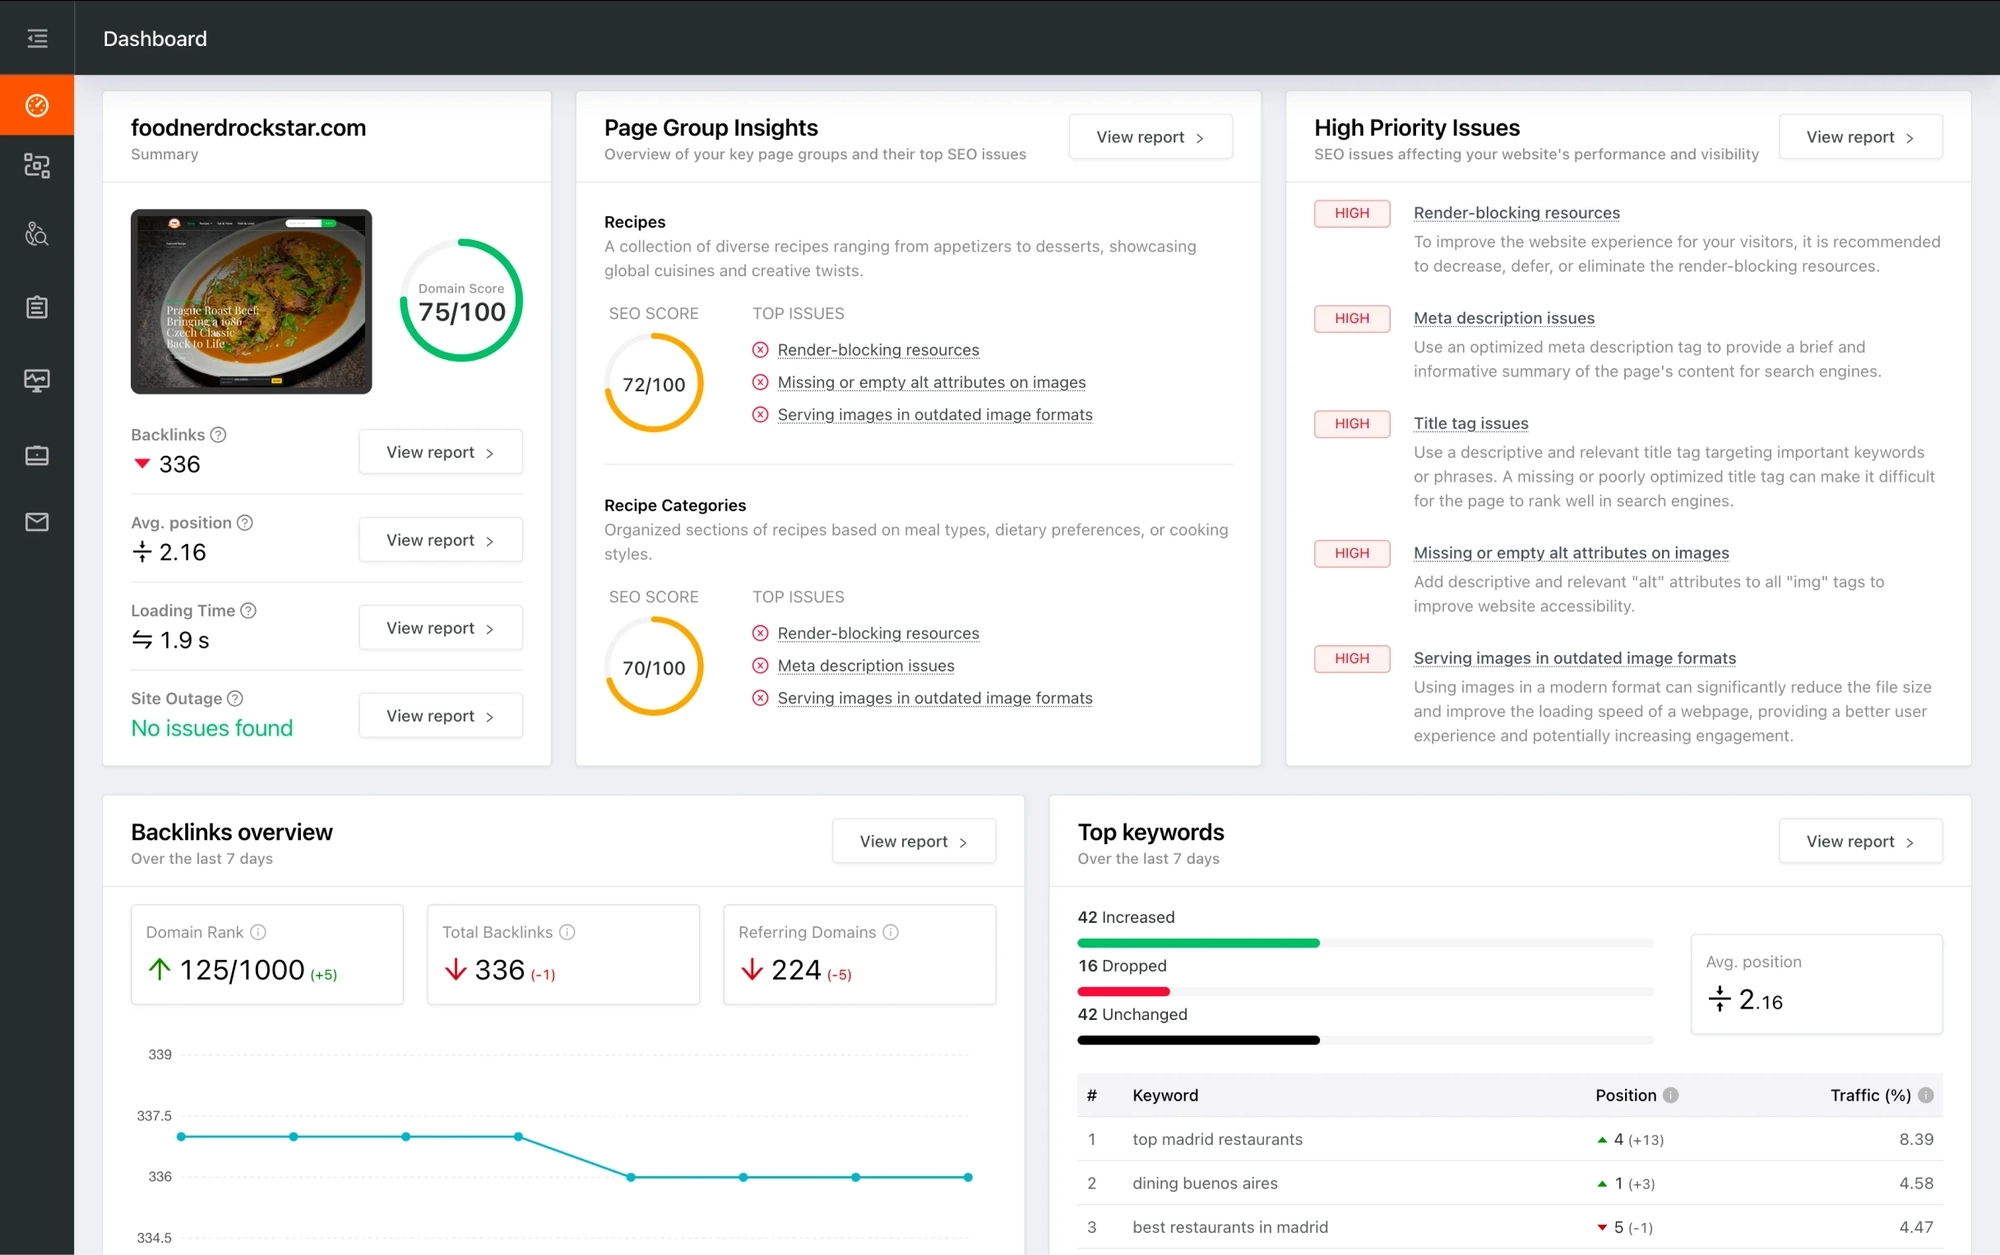
Dashboard preview showing SEO site checkup metrics, page group insights, and issue prioritization