
Content marketing is an integral part of an effective SEO strategy. Without high-quality content, an online business would find it very tough to compete in the search engine results pages (SERPs) and build a consistent stream of free organic traffic.
When we refer to “content marketing,” most people immediately think of blog posts, videos, and the content creation process. However, there is another very important part that many unfortunately ignore. That part is about identifying relevant metrics and measuring your content marketing success.
Identifying metrics that are important for you and your business is essential. If you do not know what’s working and what’s not, you won’t be able to optimize. Moreover, measuring KPIs is also important to ensure you are not spending your time and effort into something unproductive and unyielding.
Although each business may be different, in this blog post, we are going to list a few metrics that would be important for most content marketers. We will also help you find these metrics.
1. Unique and returning visitors
Most content marketers just look at “users” (Audience > Overview). It refers to unique website visitors, and while “users” is one of the most commonly tracked metrics, it may not give you detailed information or a bigger picture.
That is why we suggest — in addition to “users” — paying attention to unique and returning visitors. It gives you numerous key insights.
For example, with this data, you will be able to understand how engaging your website and its content is, and whether or not you are losing a bunch of your first-time visitors. Moreover, you can also learn how conversions on your website are affected by returning visitors.
Lastly, it is a good starting point to optimize your conversion funnel by identifying how returning visitors interact with your content and offers.
How to find information about unique and returning visitors?
- Log into your Google Analytics dashboard.
- Select the ‘Audience’ report from the life sidebar menu.
- Click on the ‘Behavior’ drop-down menu.
- Select ‘New vs. Returning’
2. Average time on page
The average time visitors spend on your pages is another good metric that all content marketers should pay attention to. It helps you gauge the level of quality and engagement your website offers to readers.
The average time on page becomes an even more important metric if your goal is to optimize conversions. After all, the more time people spend on your website, the more likely they are to buy something.
How to find information about the average time on page?
- Log in to your Google Analytics dashboard.
- Select the ‘Behavior’ report from the left sidebar menu.
- Click on the ‘Site Content’ drop-down menu.
- Select ‘All Pages.’
This will give you a breakdown of the average page on time on each page separately. You can use this data to identify outlier pages with particularly bad results. Those pages may have poor results because of the fewer words or something else.
It is also recommended to identify web pages with high traffic and high conversion rates but low average time on page. You should try to optimize those first for the best possible results.
3. Bounce rate
By using the same report as average time on page (Behavior > Site Content > All Pages), you can also find information about the bounce rate.
Google explains a bounce and the bounce rate as:
“A bounce is a single-page session on your site. In Analytics, a bounce is calculated specifically as a session that triggers only a single request to the Analytics server, such as when a user opens a single page on your site and then exits without triggering any other requests to the Analytics server during that session.
Bounce rate is single-page sessions divided by all sessions, or the percentage of all sessions on your site in which users viewed only a single page and triggered only a single request to the Analytics server.”
In summary, the bounce rate refers to the percentage of people who visit only a single web page on your website and quit without visiting any other.
A high bounce rate is bad for engagement and conversions. If visitors are not visiting multiple web pages, they might not go through the different stages of the sales funnel. Besides, a high bounce rate may also send negative signals to search engines, which is not good for search engine optimization.
4. Most popular blog posts and landing pages
The above-mentioned report (average time on page and bounce rate) will also let you identify the most popular blog posts and landing pages on your website.
This information is vital in optimizing your SEO strategy and conversion rate.
First, you can try to pinpoint a few reasons why a page is more popular than others. You can then replicate that type of content (style, word count, topic, etc.) more often.
Second, once you have identified the landing pages that bring in the most traffic, you can spend more time on those pages optimizing various elements for a better conversion rate.
5. CTR or click-through rate
To find the click-through rate or CTR, you will have to log into your Google Search Console account.
How to find information on the click-through rate?
Here is how to find this information.
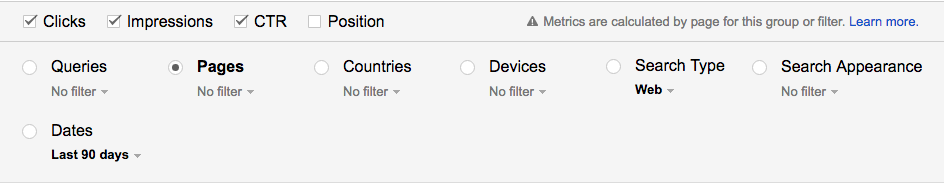
- Log in to your Google Search Console account.
- Enable the CTR option in the Search Analytics report.
- Optional: Also enable ‘Clicks’ and ‘Impressions’ for even more detailed reports.
The CTR or click-through rate is a metric that many content marketers and SEO professionals simply do not pay enough attention to. They mainly focus their efforts on getting web pages ranked higher in the SERPs. However, their job does not end there.
Merely ranking high in the SERPs does not guarantee traffic. You also have to consider the CTR your page gets — in comparison to other pages in the SERPs.
By measuring CTR for each web page and optimizing them by tweaking their meta title and meta description, you will be able to get more out of your SEO efforts.
6. Traffic sources
Lastly, content marketers should know which traffic channels and sources are most productive for them. This information is valuable in understanding your strengths and weaknesses. By identifying your best- and worst-performing traffic channels, you know where most of your content marketing budget should go to.
How to find information on traffic sources?
- Log in to your Google Analytics dashboard.
- Select the ‘Acquisition’ report from the left sidebar menu.
- Click on the ‘All Traffic’ drop-down menu.
- Select ‘Source/Medium.’
The following report will show you traffic acquisition, behavior, and conversion breakdown by traffic sources.
With this information, you can identify which sources bring you the most traffic. Moreover, you will also learn which traffic source offers you the best engagement rate or the best conversion rate.
For example, if social media websites have an unreasonably low conversion rate, perhaps your social ads and posts set up wrong expectations that — although, drives traffic to your site — leads to a poor conversion rate.
Conclusion
No content marketing or SEO strategy is complete without closely monitoring important metrics and KPIs and measuring success on a regular basis.
Make sure you are not measuring the relevant metrics and not wasting time or resources on things that do not really matter.